Home Ground Advantage – A Mess

Everyone has done a piece on home ground advantage, and now it’s my turn. This will hopefully be one of a series of posts, the next one or two will hopefully complete this module of my model and hopefully not be a complete waste of time.

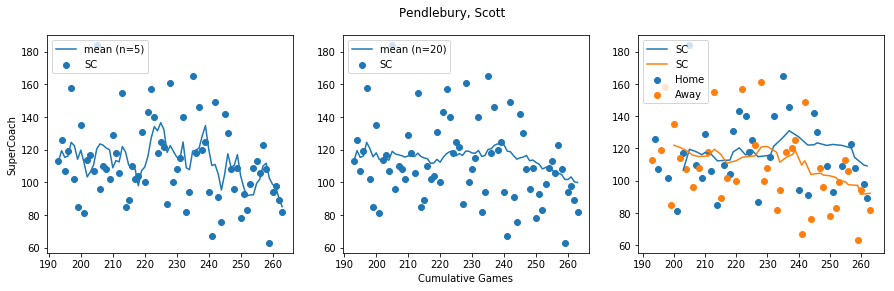
In the development of my model, figuring out how to best quantify home ground advantage was difficult to approach. At the moment, I use a very simple measure to account for “team travel”, and use adjustments for each team and player as to how they play at home or away given their upcoming fixture (i.e. Scott Pendlebury would be expected to contribute less to a Collingwood away game as his recent away form is poor.)

I have identified seven possible predictors of home ground advantage, and how each of them may be quantified:

  1. The actual venue itself
  2. “Morale” from playing to a home crowd (?)
  3. “Favouritism” from the umpires (free kick differential)
  4. Familiarity with the ground/facilities (count of previous games played for each team)
  5. Not having to travel far (travel time for each team)
  6. Players sleeping at normal home (boolean for each team)
  7. How often they travel (interstate games per season)

Most of these are measurable from available data on past games, and predictable through the fixture.

Other models deal with HGA by applying a correction to the margin in the form of a flat number (Matter of Stats), or a percentage (possibly different for each venue?), or consideration of some of the above to get a HGA variable into their model (i.e. FiguringFooty, The Arc). Some just ignore it altogether and do pretty well (HPN).

In this post I will investigate the first 3 of these identified predictors and I will investigate their usefulness (or lack thereof). Following this a general discussion of the difficulties of distilling HGA out of existing data.

***

First, let’s have a look at some of the available data to explore some of the elements of HGA. Here I am using data from 2011 onwards. I could use data from further back but I like to keep things modern.

A broad viewing of game result data shows distinct differences between many of the common AFL venues. For each ground, the distribution of the margin and total points is presented in the following figure.

EachGround

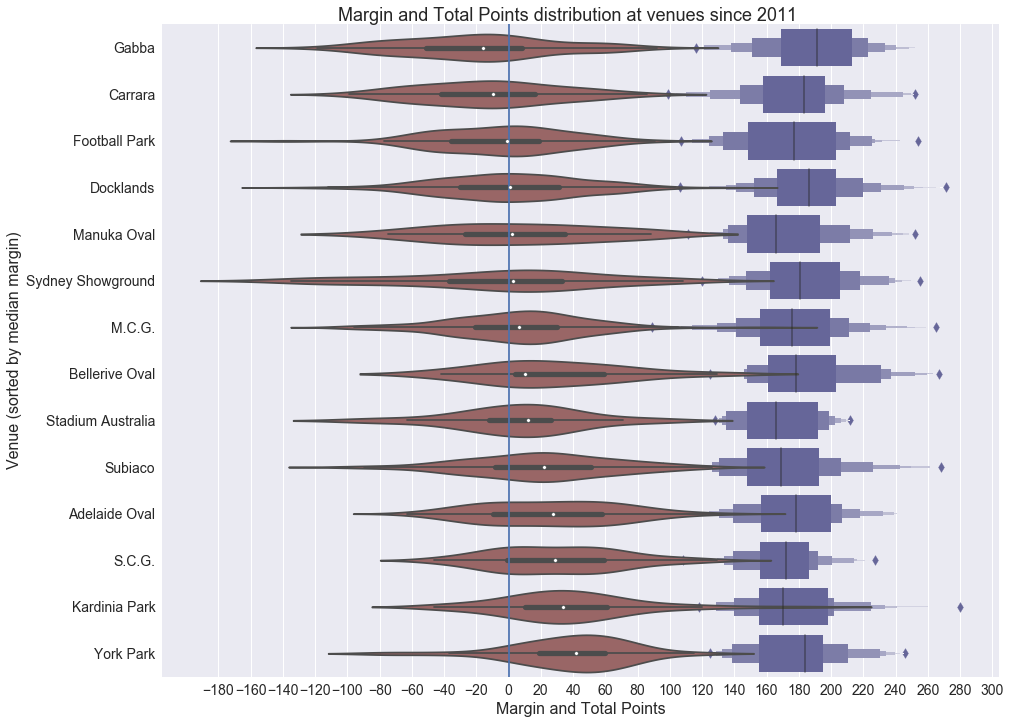
There’s a lot to unpack here. I’ve only included venues with more than 25 games played in the period or you get some real outliers (Jiangwan Stadium, for example). For clarification, a positive margin indicates a home victory.

While not a huge focus of mine at this stage, the total points scored does show variation, indicating it may be better to consider a percentage HGA bonus rather than a flat points bonus.

On the surface, the ‘Gabba is often a disadvantage to the home team; but that home team is Brisbane, who haven’t cracked the finals since 2009. York Park provides a median 42 point advantage; but Hawthorn mainly play there and they’ve been rather good. Without discounting individual margins by the strengths of the teams on the day, it’s difficult to tell whether each ground has an independent HGA, a common HGA, or no HGA at all! I’m keeping (1) as a possible predictor at the moment until more analysis can be done.

The more interesting data, perhaps, is that of the Melbourne venues MCG and Docklands. Firstly, the large number of games played there gives a better set of data to examine. Secondly, all Melbourne teams play home games there so on average, there should be less bias towards “how good” the home team is. If we filter games to Melbourne teams vs Melbourne teams (i.e. not Geelong) at the MCG and Docklands, things look very even!

MelbvsMelb

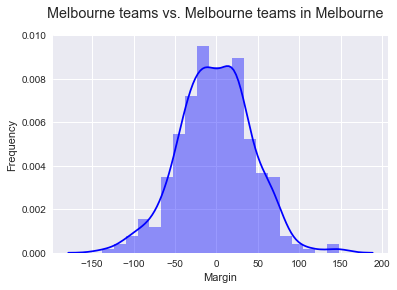
For this data (360 games), the mean is -0.825 and the median margin is -1. There is no perceptible skewness in the distribution. From this sample, it cannot be said that there is an advantage (p\approx 0.71). But is this actually important? The only differences for the home and away team in this set of games is the change rooms they use (I think?). I suspect there may be a larger ratio of home fans in attendance but given the capacity of the grounds, not many fans would be locked out. Either way it makes no perceptible difference. At least for moderate differences in crowd it’s probably acceptable to dismiss (2) as a possible predictor.

***

Let’s now consider another common gripe about Home Ground Advantage, that of the perceived favouritism of umpiring decisions. My personal view is that the free kick differential is not indicative of favouritism, and more indicative of player indiscipline. Possibly this is a mental effect from playing away from home! Without reviewing every decision and classifying each as a “justified” free kick or an “umpiring error”, it is not possible to comment on favouritism as a concept. Nevertheless, let us look at whether teams get more free kicks at home, and if this results in more wins.

FKvsMargin

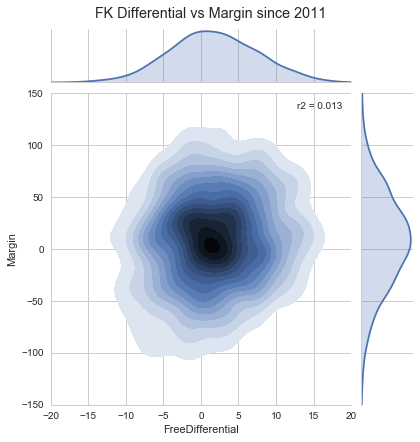
This is the data from all games since 2011. In the central plot, a darker colour means a higher frequency of data. On the right-hand side is the distribution of margins (positive means a home victory) and on the top is the distribution of free kick differential (positive means more home free kicks).

Firstly, home teams DO get more free kicks (p<10^{-12}). From the 1554 samples, on average, home sides get 1.70 more free kicks. And of course, home teams score more than their opposition, (p<10^{-10}), 7.97 points on average.

On the face of it you could easily make the connection that free kick differential correlates with the margin. The central plot tells the story that this is simply not true. The free kick differential is not a good predictor of the margin. There are many games where the free kick differential and margin have the opposite sign, almost as many as where they have the same sign. Just beacuse I’m playing around with visualisations at the moment, here is a plot of the Inside 50s differential vs. the Margin:

I50vsMargin

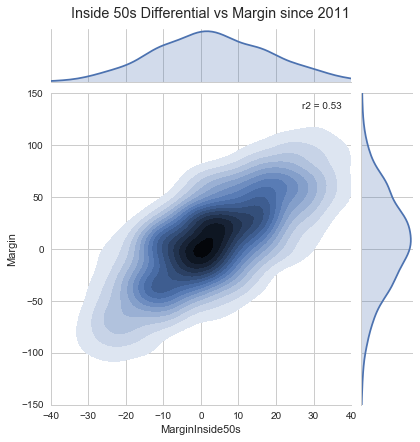
This is a much better predictor.

I aim to look at some of the other predictors (4-7) in a later piece after I have done some more work on it. For the moment I’m just going to consider some thoughts on how to proceed after doing this work!

***

The Scale of the Problem

There are a number of challenges facing this analysis. Firstly, let us assume the following model for predicting the outcome of a match

diagram-20180628

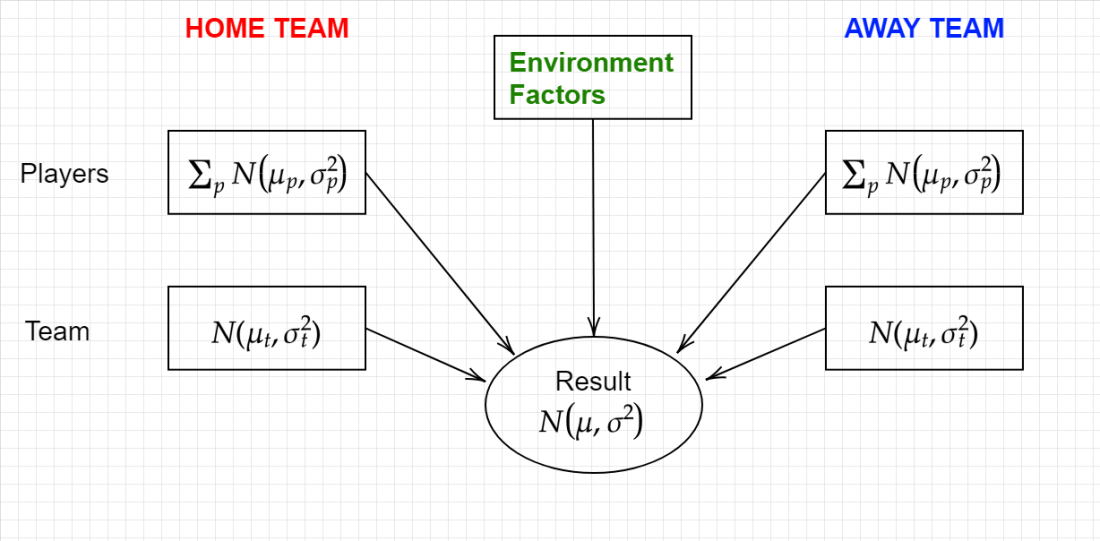
The team performance and player performance of each team may be predicted using their form. Environment factors include things such as HGA, the weather, and other possible factors such as if a team is coming off a short break or the bye.

To get a good measure for HGA one would need to dial out, for each past game, the effect of team performance, player performance, and non-HGA environment factors to work out an adjusted “game HGA”. From this measure, a model with each of the relevant HGA “predictors” identified could be matched.

Without doing any of the quantitative measurements, it’s easy to argue why this is going to at least be very difficult. The HGA is prevalent in the team and player performance too. Although this can be predicted from past data, this means that the full effect of HGA will be difficult to sum up. Furthermore, after removing player and team performance bias, the question remains on how to account for other environmental factors. It will likely be necessary to fit all environmental predictors (HGA, weather, etc.) simultaneously.

Then there are other problems. Is it possible that each venue has its own HGA independent of other factors? Does this change over time, i.e. how does stadium development affect this?

While I have a decent grasp on team and player performance, my model currently neglects to take weather into account (more on this in a future post I hope) and already includes HGA bias for the team and player performance. I am not in a position to attempt this quantitatively at this stage.

Nevertheless, I have some better ideas of how to proceed with this difficult problem. Firstly, I need to use player and team performance to quantify a residual “environmental” margin for each game (encompassing HGA, weather effects and noise), then examine the effects of venue, travel time, days between matches, and determine a way of describing the effect of weather.

It’s easy to see why a simple measure of HGA is attractive.

To be continued.

-Adam


Round 14 Review


Not a brilliant week with the Melbourne tip but I was happy with it at the time.

r14results

The “exotic” tip brings me back to the pack a bit but it’s still a very good pack!

r14tables

Working on a few more things, including a simulation of the rest of the season.

2018-AfterR14

A lot of changes since last week, West Coast lost out a lot. These simulations are based off no changes to the latest team list, so with JJK/Darling back that’d probably change. The order is based on the mean ladder position from 10,000 season simulations. My percentages are a bit more definitive than some other (better) models’ ladder simulations but isn’t too far off!

I’m also trialing a new measure of the “best team”; I simulate a home-and-away round-robin fixture, so each team plays each other twice at each of their home grounds. I’m still working on a nicer way to present this, but for the moment I’m using the same ladder presentation.

2018-AfterR14-RR

I expected this to be a bit more definitive but it’s much more spread than I thought! Note that again, the percentage is chance of getting in the (hypothetical) top 8. There’s a tremendous divide from 14th and under and it’s VERY tight at the top. It’s a shame the draw isn’t even!

-Adam

Round 13 Review

I had made some changes to my model on Friday and screwed things up a little bit, after finding the mistake late Friday evening (post-bounce) I noticed my simulation then predicted a Sydney victory but I was happy enough to take the gamble on the Eagles! Some tough games went my way in the tipping (thanks Saints!) but it didn’t reward me with too many bits.

r13results

I’m currently drafting some changes to my model to include a predictor variable for weather once I nail down a process for scraping and categorising weather for past matches. I’m sure this will have a positive effect on reducing my MAE; which is unacceptable.

I’m hanging on to second place in my table since I’ve gone “live”… assuming bits are more important 😛

r13tables

-Adam

How do you measure a player’s form?

A key part of my model is the concept that the selected players, along with the less player-specific team performance, determine the strength of the team as a whole. Here I’m going to discuss some ways to measure a player’s form to, hopefully, accurately predict their performance in an upcoming game.

Imagine for a moment each player’s value is described by a single score; I’ll use Supercoach points for this example. How do you best predict what the player’s score will be in their next game?

Speaking of Supercoach, the site provides projected scores for upcoming matches:

“Projected scores are calculated using the Herald Sun SuperCoach AFL’s proprietary formula, which takes into account several factors including the player’s most recent performances, their direct performances against the opponent and their past performance at the venue.”

This is fairly self explanatory, it uses recent form (rolling mean from n matches), form against the opposition team and form at the game’s venue. I understand the thinking behind the latter two measures but personally I would be hesitant to use them. Most players play each team only once per year; the carryover form seems tenuous unless they happen to play on the same opponent player, against the same gameplan. Likewise, the venue form will only be useful for the home team.

The AFL Ratings system uses a long-term forecast to rate a player’s value:

“A player’s rating is determined by aggregating his points tally based on a rolling window of the previous two seasons. … only a player’s most recent 40 matches are used in the calculation of his rating. … A player’s most recent 30 matches are given greater weight in determining his rating. Matches 31 through 40 are progressively reduced in weighting”

This is a different kettle of fish. The trend over a long time is a better measure of a career value, rather than a form. As I write this, Scott Pendlebury is the 5th highest rated player in the league. He’s not in good form though (**see below), so he’s unlikely to rank that highly in his next round.

How can you handle cases like Tom McDonald and James Sicily, who have been moved to the other end of the ground and their output has changed (improved?) dramatically? I think there needs to be an element of long-term and short-term form. Let’s look at some case studies using my terrible visualisations.

Here are Scott Pendlebury’s Supercoach scores for the last few years.

Pendlebury

The first two plots have rolling means of the last 5 and 20 games respectively (**he’s clearly out of form on this measure). The final plot I’ve separated his home and away games and plotted a rolling mean of his last 10 home/away games. Maybe his calf injury is hanging around and he’s not travelling well? Let’s check some others out.

Hurn

Shannon Hurn is a nicer player to model; plenty of variation as you’d expect but a nice clean upward drift on the 20-game average; it’s probably a better predictor of future performance. Lately he’s been showing better form away than at home. Bodes well for the finals.

Sicily.png

Finally, James Sicily has gone through that transformation from forward to back and has shown a dramatic improvement in this measure. His 20-game average is taking a while to catch up and it’s likely his 5-game average will be a better predictor.

With just a few examples it’s easy to see why there are benefits with a short-term and a long-term mean. There is possibly some benefit of considering home and away form separately too.

My model considers a weight of these three means for predicting the mean output of a player – their current form. Each of the seven (!) parameters I use to measure a player’s performance gets a mean of this form. The choice of 5- and 20-game means passes the eye test (for me, anyway) and gives good outcomes when simulating past seasons. Rookie players with n<5 games just have a mean of all of their performances, players with 5<n<20 get a 5-game mean and a n-game mean.

***

Now, what about the game-to-game variance from the mean(s)? The means will be good for giving a mean outcomes but variance will be useful in determining the probability of outcomes. In the finance industry, estimating volatility is where the money is.

I need to do more investigation on the best way of handling this, and I might write a piece when it’s a little more refined. My current method is to take a sample standard deviation of the measure over 10 games. I had been using 5 games and this was giving me some strange outcomes. Having done some more simulations, 10 seems to work pretty well as compared to larger and smaller samples.

Cheers for now!

-Adam

Round 12 Review

A bit of a tough round to tip with plenty of close games, a few upsets and a few blowouts really damaging my MAE, especially with the model’s margin underestimation. Oh well, it’s a beta!

r12results

Still measuring up well overall over the generous sample size of two live rounds. The relative indecisiveness in closer games is helping me salvage some Bits.

r12table

Onwards and upwards… after this man-flu leaves!

-Adam

An Introduction to the Model

Absolutely no-one has asked me for details on my methodology yet, and I’m happy to provide answers for these non-existent questions.

I guess the main idea behind the model is the concept of a team being more than just a sum of its players.

\displaystyle P = P_t + \sum_i P_i

Overall performance P is a sum of team-related performance P_t and the total contribution from each of the players P_i.

I arrived at this idea from observing the freely available statistics that are published by invaluable sites such as AFLTables and Footywire. Individual player contributions are easy to see and understand, but there are other features in the stats I was interested in; for example, does a Rebound 50 reflect on the performance of the player awarded the stat, or is it more closely related to the defensive structure of the team as a whole? Is five Rebound 50s worth as much if the opposition have had 80 inside 50s, as opposed to 40?

I divided the relevant statistics (almost all of them?) into different categories of team and player performance. I arrived at seven different categories. As is the go in footy data analysis circles I came up with a snappy acronym; SOLDIER. For each of the categories, I painstakingly weighted each relevant statistic to favour the statistics that better correlate with the outcome (winning the game). A team performance in a game is described by FOURTEEN (!) variables; seven for the sum of player performance and seven for the team performance. For each game, the difference in these fourteen variables is hypothesised to relate to the difference in the final scores, i.e. the margin.

I recognise that this model is considerably more complicated than other footy models I’ve read about online, but footy is a complicated game!

I began this project after spending some time learning about data analysis; in particular applying machine learning techniques. After doing a few beginner projects through sites like Kaggle, I figured I had enough of the basics to give this project a crack. Unlike the rest of my mathematical life where I use techniques that I have a strong base of understanding in, I have no more than a basic understanding of how machine learning actually works.

Once I have a better grasp on machine learning and refine my model, and the many parameters embedded within, I may publish more details on the categories and the statistics important to each.

I hope to be in a position to be able to predict results, rank players, make ladder predictions, but also to see if the machine learning models can give any insights into concepts such as team balance, matching up of teams with different strengths and weaknesses, etc.

This is primarily a learning exercise for me but I believe (please correct me!) that no other well-discussed footy model is using machine learning techniques, so I hope this is of interest.

-Adam


Round 11 Review

A pretty good round I think. My models seem to be under-predicting margins, something I didn’t really pick up until I started looking at individual games. Having said that, my probabilities are tending to be higher than other models around and that really helped my BITS score.

r11results

Perhaps the volatility estimation for player/team performances I’m using is not optimal and I’m getting a skinnier bell curve of simulated results than others. We shall see!

This year I’ll be focussing on tweaking my model, sussing out its strengths and weaknesses and measuring it up against others. Although I have simulated data from the first 10 rounds, that was simulated blind to the actual results, I will be measuring it against results only from this round onwards; just in case my slightly messy code managed to have prior knowledge.

r11table.PNG

-Adam

The AFL Lab

Welcome to the AFL Lab. This project is part of my ongoing education in data analysis. I love footy and numbers, so why not combine the two? I have a strong mathematical background but I’m comparatively weak on the statistics side. This is my attempt to rectify this, in a very reckless and un-rigorous way.

Normally when approaching a problem it is standard practice to start with something simple and add complexity (Occam’s Razor?), but I have gone all-in, throwing stats haphazardly at scikit-learn models. Will it work or will it explode?

My formulation is currently very unrefined, with many parameters (and probably way too many parameters) yet to be tweaked. Nevertheless, having simulated Rounds 1-10, 2018, my model has tipped 63, average margin 28.5 and a bits score of 16.61. According to the Squiggle leaderboard as of today, the leading model is on 62/28.17/14.58.

The model is not completely ready yet (it’s about 5 tips behind in a simulation of 2017), but it’s doing something right. So over the next few weeks I might write a few things about my modelling process and I’ll post round predictions/reviews and any other little fun bits I’ve found.

I’ll probably post a bit more frequently on Twitter at @AFLLab

-Adam